

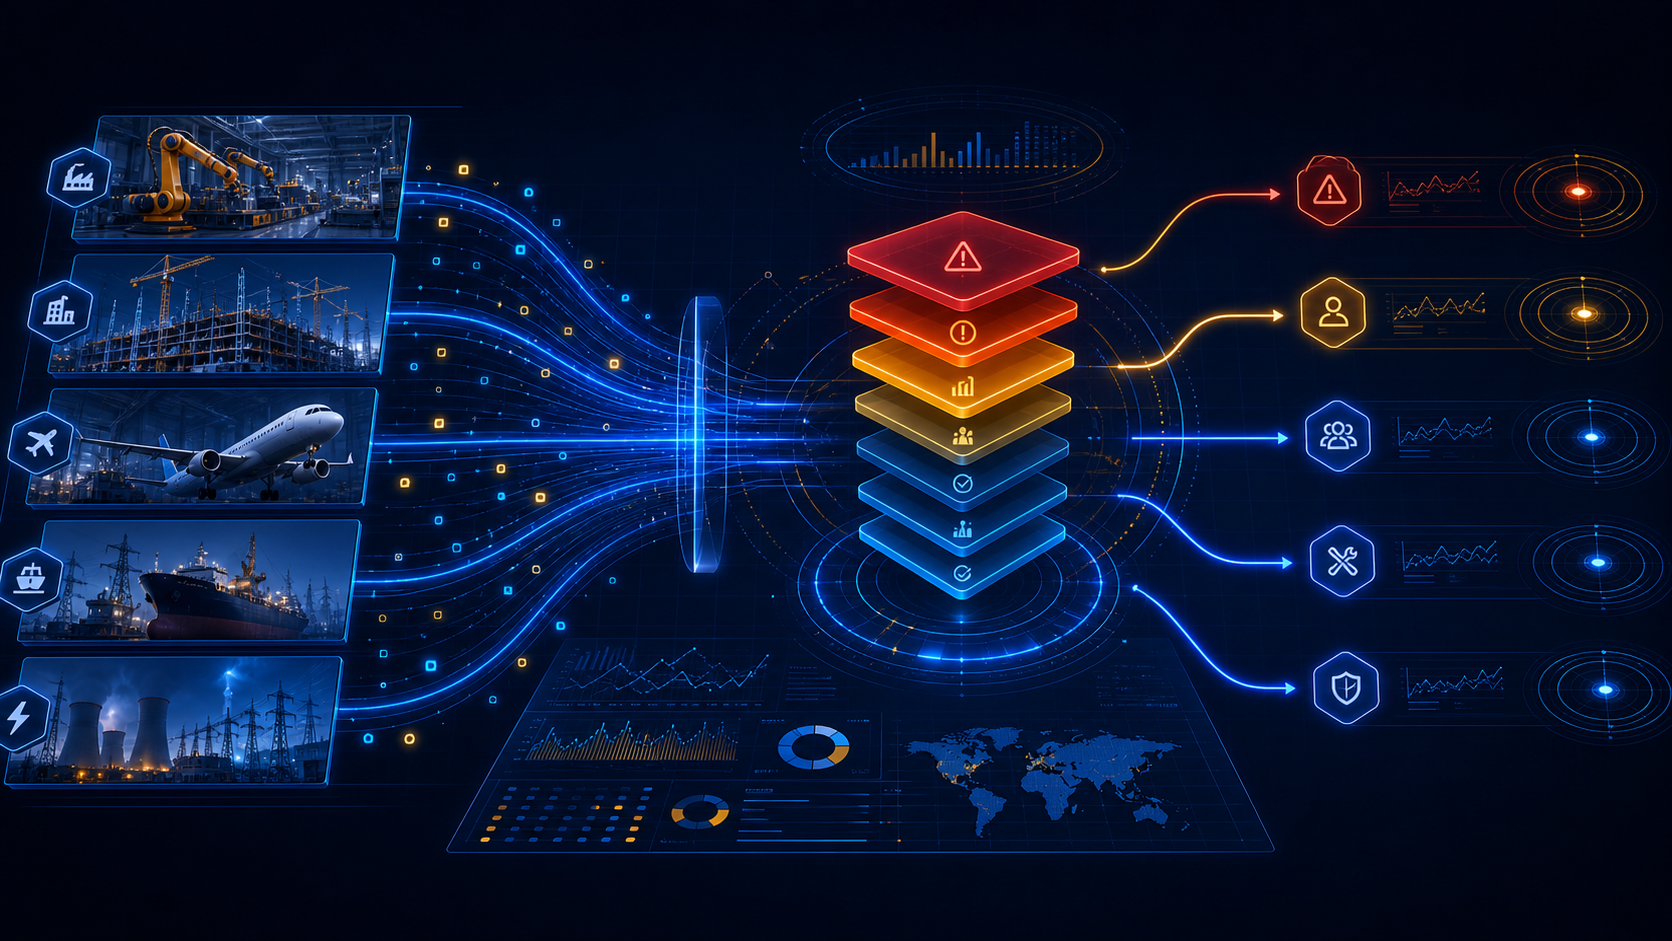
Industrial Signal Collection
Continuously ingest signals from manufacturing lines, automotive operations, construction and infrastructure projects, aerospace programs, shipyards, energy assets, utilities, field teams, inspections, and corrective actions.
What this can look like
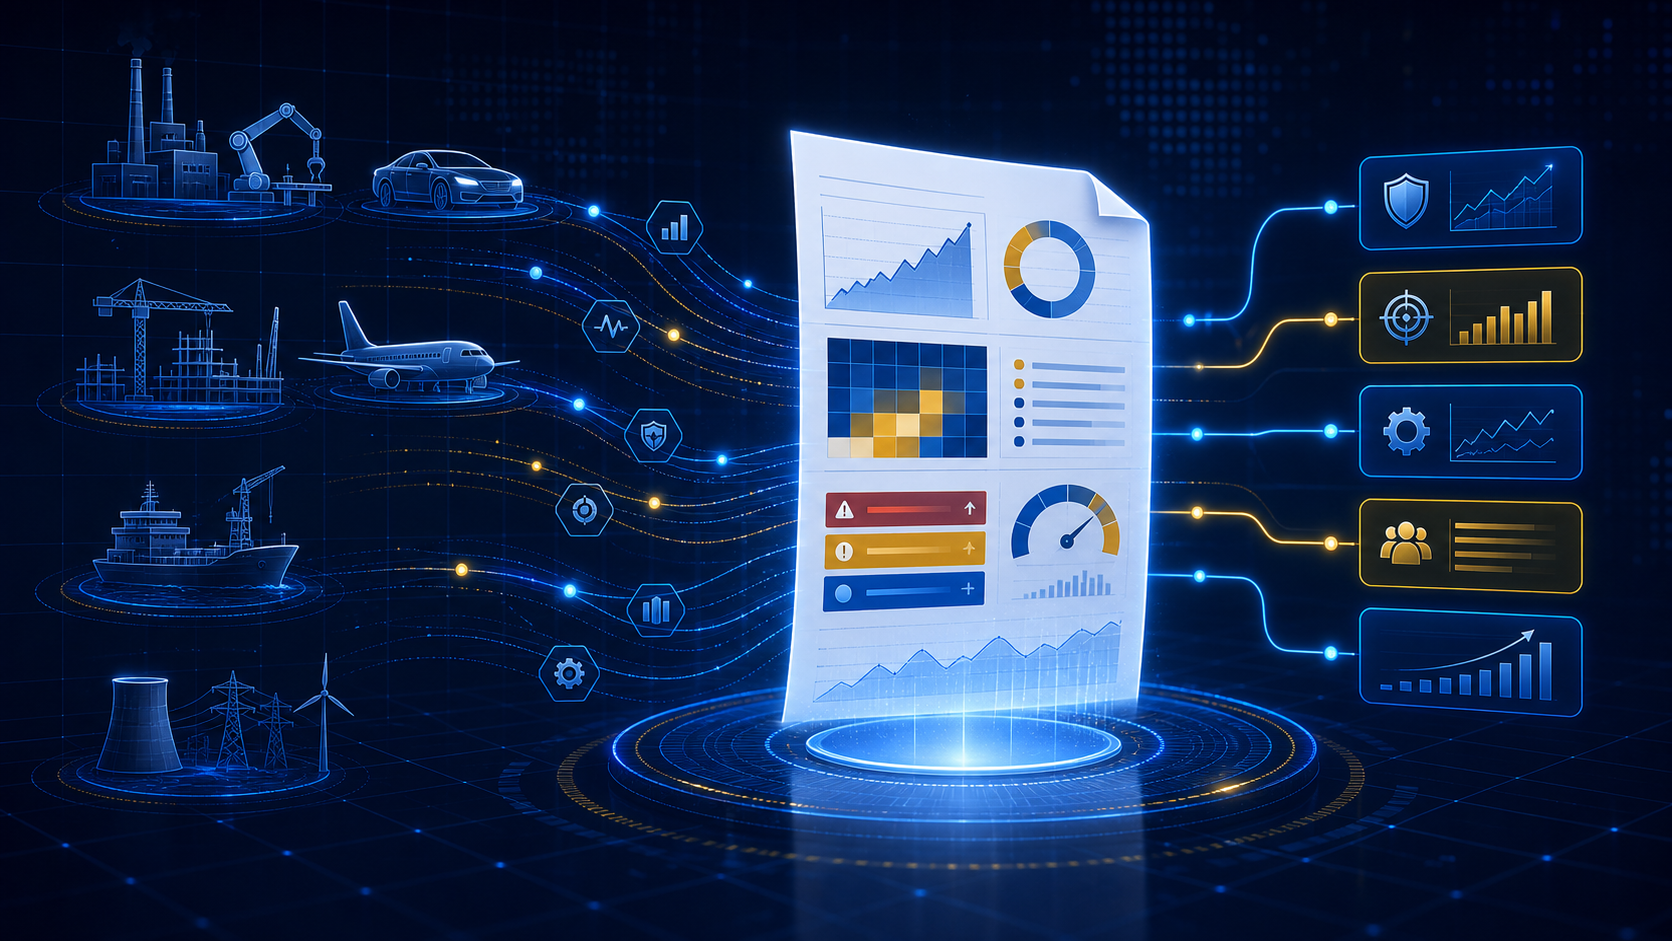
- Daily feeds from operating systems, project controls, field logs, inspections, maintenance records, service events, and workflow activity.
- Structured and open-text inputs normalized into comparable industrial risk categories.
- Ownership, asset, site, project, timing, completion, and escalation context attached to each signal.
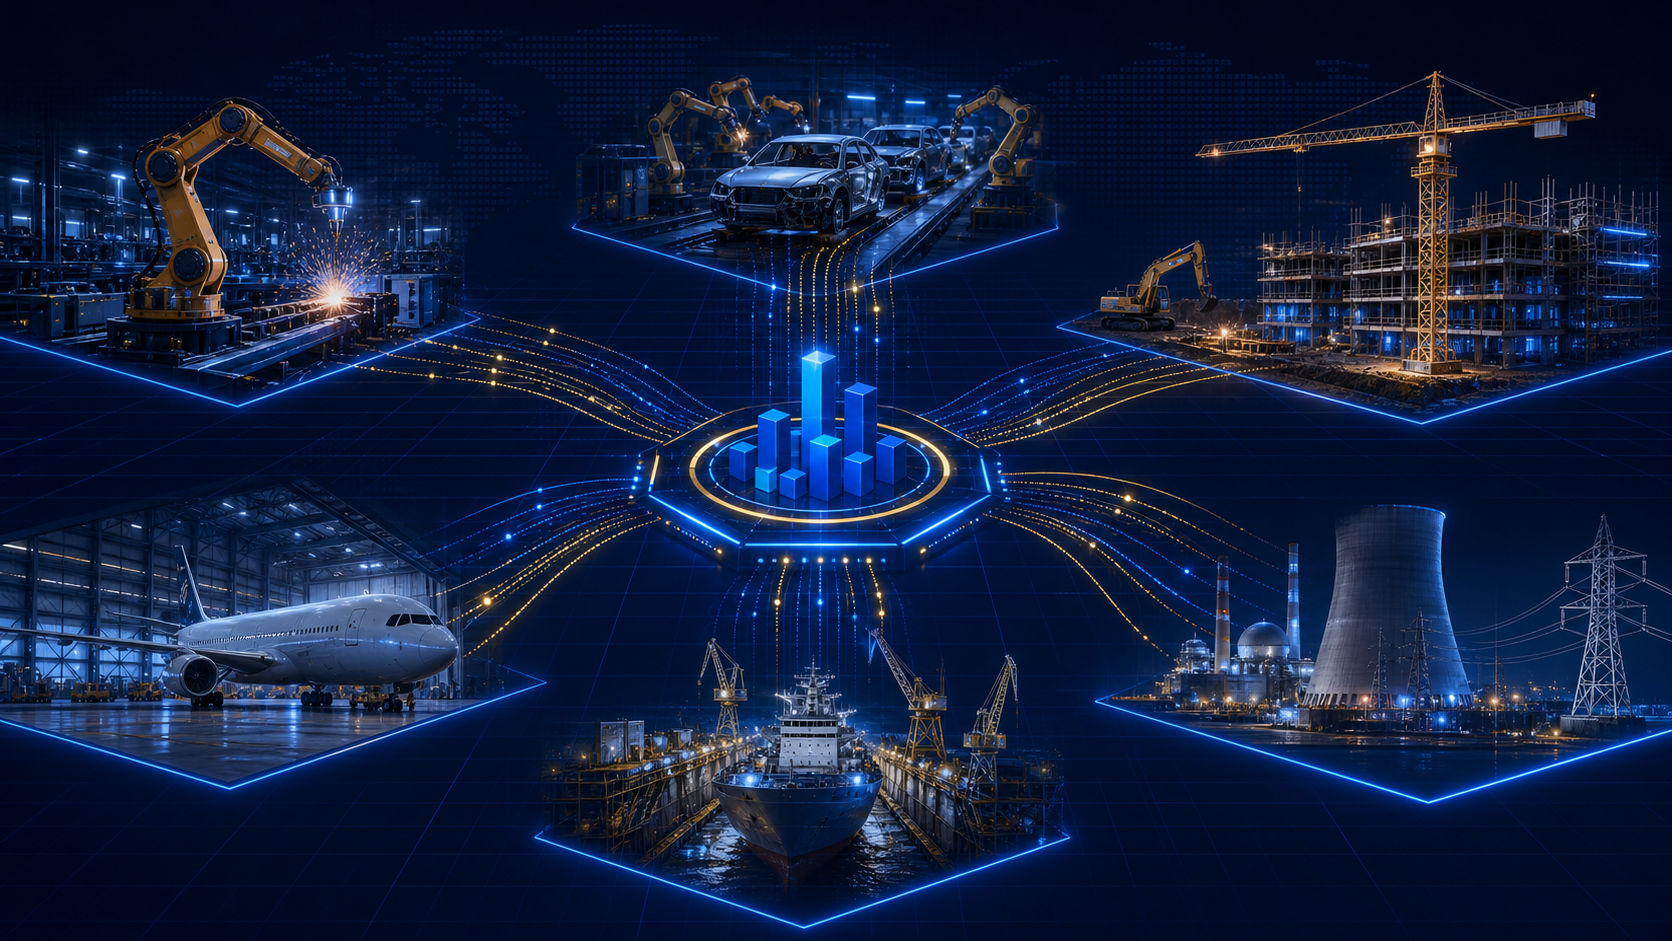
Sources
- Manufacturing and automotive
- Construction and infrastructure
- Aerospace programs
- Shipbuilding operations
- Energy and utilities
- Field and service teams