Duplicate customers
Resolve match and merge rules, survivorship logic, identifiers, and downstream reporting impacts.
Data Quality & Analytics Reliability
Data quality is not just a technical issue. It is a business reliability issue. When leaders question which number is right, whether a dashboard refreshed, or whether definitions changed, analytics loses credibility.
Parallax Data Lab helps organizations improve the reliability of their analytics environment by identifying reporting risks, inconsistent definitions, data quality gaps, and governance issues that reduce confidence in decision-making.
Where this applies
Resolve match and merge rules, survivorship logic, identifiers, and downstream reporting impacts.
Identify where records fall out or arrive after reporting cutoffs, then add checks and visible exception handling.
Rebuild product, customer, account, facility, or organizational mappings and document who owns changes.
Correct grain, key, relationship, and transformation logic that creates duplicated or missing totals.
Make manual corrections and special-case rules visible, testable, approved, and maintainable.
Align source availability, pipeline timing, semantic refreshes, and report timestamps so users know how current the number is.
How to think about the work
Data quality is not only whether a table has blanks. In reporting, quality means the data is accurate enough for the decision, complete enough for the audience, consistent across systems, timely enough for the meeting, and traceable enough for leaders to understand. A late order status, duplicated customer record, unowned mapping table, or manually corrected spreadsheet can each break trust in a different way.
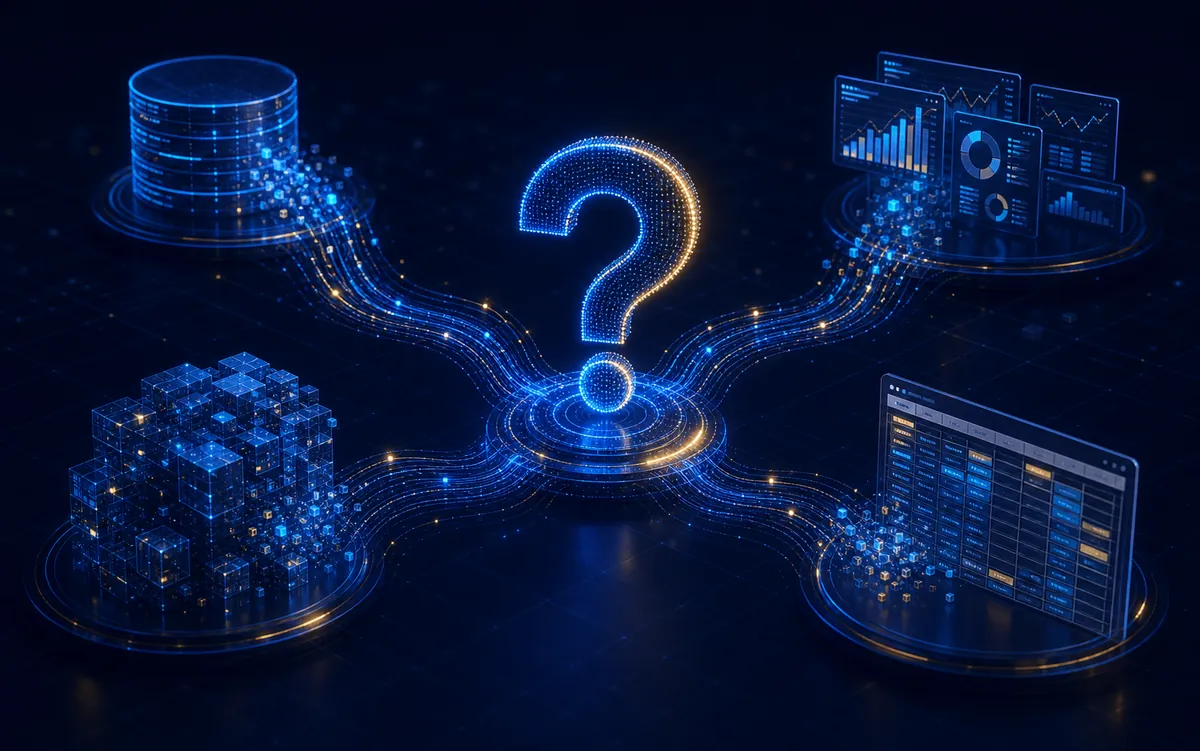
Quality issues often begin upstream: duplicated customer records, inconsistent product hierarchies, late operational entries, manual spreadsheet patches, unowned mapping tables, or business rules that changed without documentation. By the time the issue reaches Power BI or an executive scorecard, the dashboard is blamed for a problem that started much earlier. A review traces the path instead of guessing at the symptom.
Parallax traces the issue, then helps implement the fix: correcting transformation logic, rebuilding mappings, strengthening joins, adding validation checks, documenting business rules, assigning owners, and establishing ongoing monitoring and exception alerts. The goal is known confidence and a data path that stays reliable after the review.
How the work is delivered
The engagement is organized around concrete work products, implementation decisions, and the operating controls needed to keep the result useful.
Follow critical numbers from source systems through transformations, manual edits, semantic models, and final reports.
A lineage view follows the disputed product count from operational entry through extracts, transformation joins, the gold table, semantic logic, and the final report filter.
Identify missing records, late data, incomplete dimensions, and fields that limit decision usefulness.
A validation table compares expected and received product records by source, date, facility, and status to expose missing or late data.
Find where systems, teams, dashboards, or spreadsheets define the same business object differently.
A cross-system comparison shows where product codes, descriptions, categories, and hierarchy assignments disagree across operational and reporting systems.
Document manual overrides, special cases, one-off corrections, and judgment calls that affect reported numbers.
An exception register records temporary product overrides, business reason, approver, effective period, and the permanent correction path.
Clarify who owns source fixes, transformation logic, definitions, and ongoing monitoring.
The ownership model separates who approves product mappings, who implements gold-table changes, who monitors exceptions, and who validates reporting impact.
Correct business rules, joins, mapping tables, hierarchy logic, and repeated manual adjustments.
A governed mapping table resolves product merges, replacements, corrections, and hierarchy rules once for every downstream report.
Implement completeness, freshness, consistency, uniqueness, and reconciliation checks with visible exception alerts.
Automated tests flag unmapped products, duplicate active mappings, invalid effective dates, broken relationships, and unexpected category movement.
Define monitoring cadence, failure ownership, escalation, documentation, and the process for approving rule changes.
A recurring quality review tracks open exceptions, mapping changes, failed tests, downstream impact, ownership, and resolution status.
Anonymized case study
Source-to-report trace, mapping decision log, effective-dated gold mapping table, merge and survivorship rules, validation suite, exception report, and downstream reconciliation checklist.
Modern analytics readiness
Automated quality checks, visible exceptions, traceable definitions, monitored pipelines, and explicit ownership improve dashboards today and prevent AI systems from confidently repeating unreliable inputs tomorrow.
Questions
Not exactly. The review includes technical tracing, but it is focused on reporting trust and business decision impact.
No. You need known data. Leaders can act with imperfect data when the limits, owners, and confidence level are clear.
Often it should. Automating a low-quality process can make unreliable reporting spread faster.
It can. The work can move from diagnosis into transformation fixes, mapping rebuilds, validation rules, exception alerts, documentation, and monitoring based on the agreed scope.
Start with fit
Start with the free Fit Check. The goal is to route the problem to the smallest useful next step, whether that is a focused expertise review or a broader offering.
Book a 15-Minute Fit Check